

The Gaslighting of America?

On February 2 the Bureau of Labor Statistics (BLS) released the January jobs report.
The corporate media exploded with the unexpectedly high 353K jobs created, the most since January 2023. 353K was twice the 185K estimate determined by leading economists. Further, the unemployment rate stayed the same at 4.1%, while average hourly earnings rose from 4.1% to 4.5%.
This was broadcast far and wide by the corporate media as terrific news. But was it? Did anyone look at the data a bit more closely?
I’ve written about the BLS before. In It’s the Economy, Stupid I explained some of the details of the employment data we receive.
With the January, 2024 report, we need to dig a bit deeper into why the numbers are as good as presented.
Jobs Growth
Every month ADP, the payroll company, provides its estimate of the number of jobs created. No one expects this estimate to agree with the BLS jobs number, but one would expect that the numbers would be relatively close, since they both come from corporate reporting.
Here is the data for 2023. There were only three months where ADP exceeded the BLS, and only one of which was by a significant amount. In the remaining months the BLS numbers are all much higher.
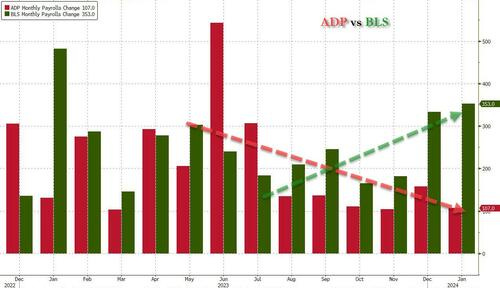
There’s another interesting thing about this chart. If you note the dotted trendlines, the ADP numbers are decreasing while the BLS numbers are increasing. Since ADP uses employment numbers obtained directly from companies, their numbers reflect the real-world, whereas the BLS numbers are “seasonally adjusted.” Regardless, one would expect the numbers to roughly follow the same direction.
Household Survey vs. Payroll Survey
The employment data we get on the news each month is from the BLS payrolls survey as reported by businesses (the U3 unemployment rate). The BLS also conducts a household survey (the U6 unemployment rate) by interviewing regular households like ours to see who is working.
Normally these two statistics offer similar values month-to-month. In general, the household survey is considered to be more accurate because it picks up “gig” workers like Uber drivers, plus it includes independent contractors (like me, for instance) who are not on a company payroll. As a result, the U6 number should exceed the U3 number since additional workers are counted.
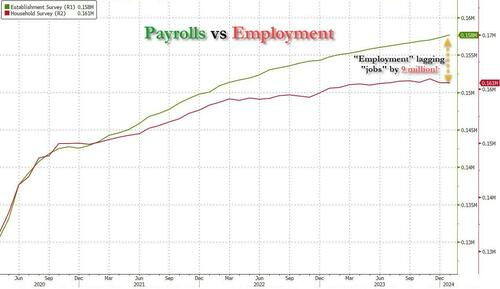
Here’s an interesting chart. It shows the number of workers employed, based upon the U3 payrolls data (in green) and the U6 household survey (in red).
In approximately March of 2021 these numbers have begun diverging. By January 2024 the reported gap is approximately 9 million workers! Where did this discrepancy come from? Theoretically, the household survey value should exceed the payroll value, since the household counts non-corporate workers. What’s going on here?
Average Hours Worked
The BLS reduced the average number of hours worked from 34.3 to 34.1. Excluding a temporary decrease for Covid lockdowns in early 2020, this change gave us the lowest value since the financial crisis of 2009.
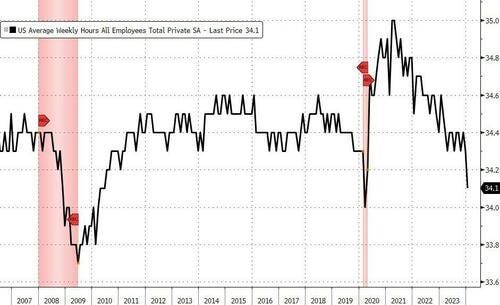
It was this seemingly minor change that gave us the increase in hourly earnings.
But what caused the change? Perhaps it was the fact that our economy is not creating full-time jobs.
Full-time vs. Part-time Workers
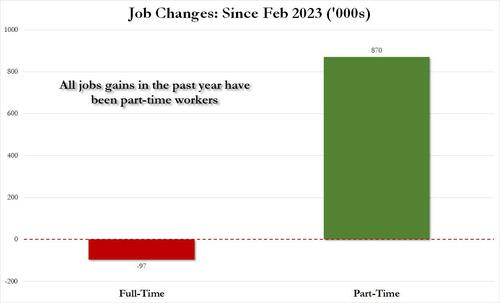
Every month we hear that XXX thousand jobs have been created. The corporate media rarely digs into this number.
So, what kinds of jobs have been created? Well since February 2023 our economy has created 870,000 part-time jobs and lost 97,000 full-time jobs. Not too good, eh?
Who’s Working?
The St. Louis Federal Reserve tracks whether workers are native- or foreign-born. This chart tells the story:
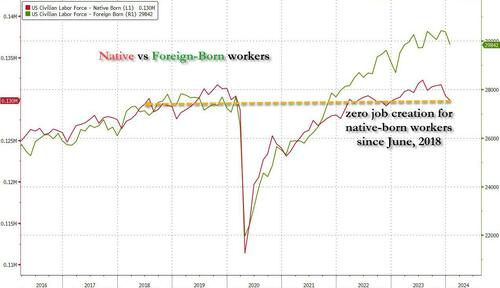
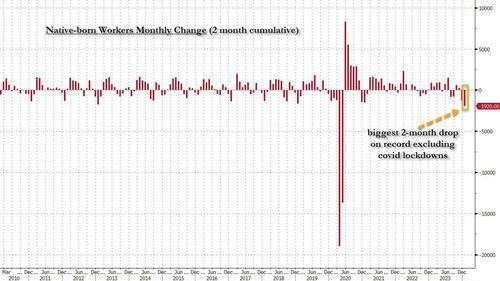
Basically, there has been no native-born job growth since June of 2018. In fact, in the last two months the number of native-born workers has dropped by 1.9 million!
* * *
I’ve written before about how the government presents rosy data that differs from what we experience. See Who Ya Gonna Believe, “Them” or Your Own Eyes.
I’m sure “cooking the books” is nothing new. It just seems to be happening more often recently.
Unfortunately, there are few in the media who look very closely at these numbers; instead, just reporting the top-line “feel good” number.
I don’t really feel good about any of these numbers.
How about you?
Good read, Chuck